Landing Page
The landing page shows Summary information about the people (users), hardware, and applications in your SysTrack environment. Each of the data sets can be further explored by clicking on the interactive components. If you do not have the correct permissions you will only be able to view the summary data and will be unable to drill down to the data sets.
The landing page also contains valuable digital experience insight from the data in your SysTrack environment. This will be showcased on the carousel at the bottom of the page. The data behind each insight card can be further explored by clicking on the view more button.

Welcome!

You have been successfully collecting data from <number of systems>. - The number of systems is the total number of systems in your environment. This includes all systems associated to the SysTrack cloud master. It may include systems that have not condensed data for some time, and new systems that have not condensed data yet.
The <number> of systems online. - This is the number of systems with an agent running and connected to SysTrack Cloud.
People

View More - Shortcut to User Details in Personas Visualizer.
NOTE: This only shows if the user has the required permissions for the Persona Visualizer.
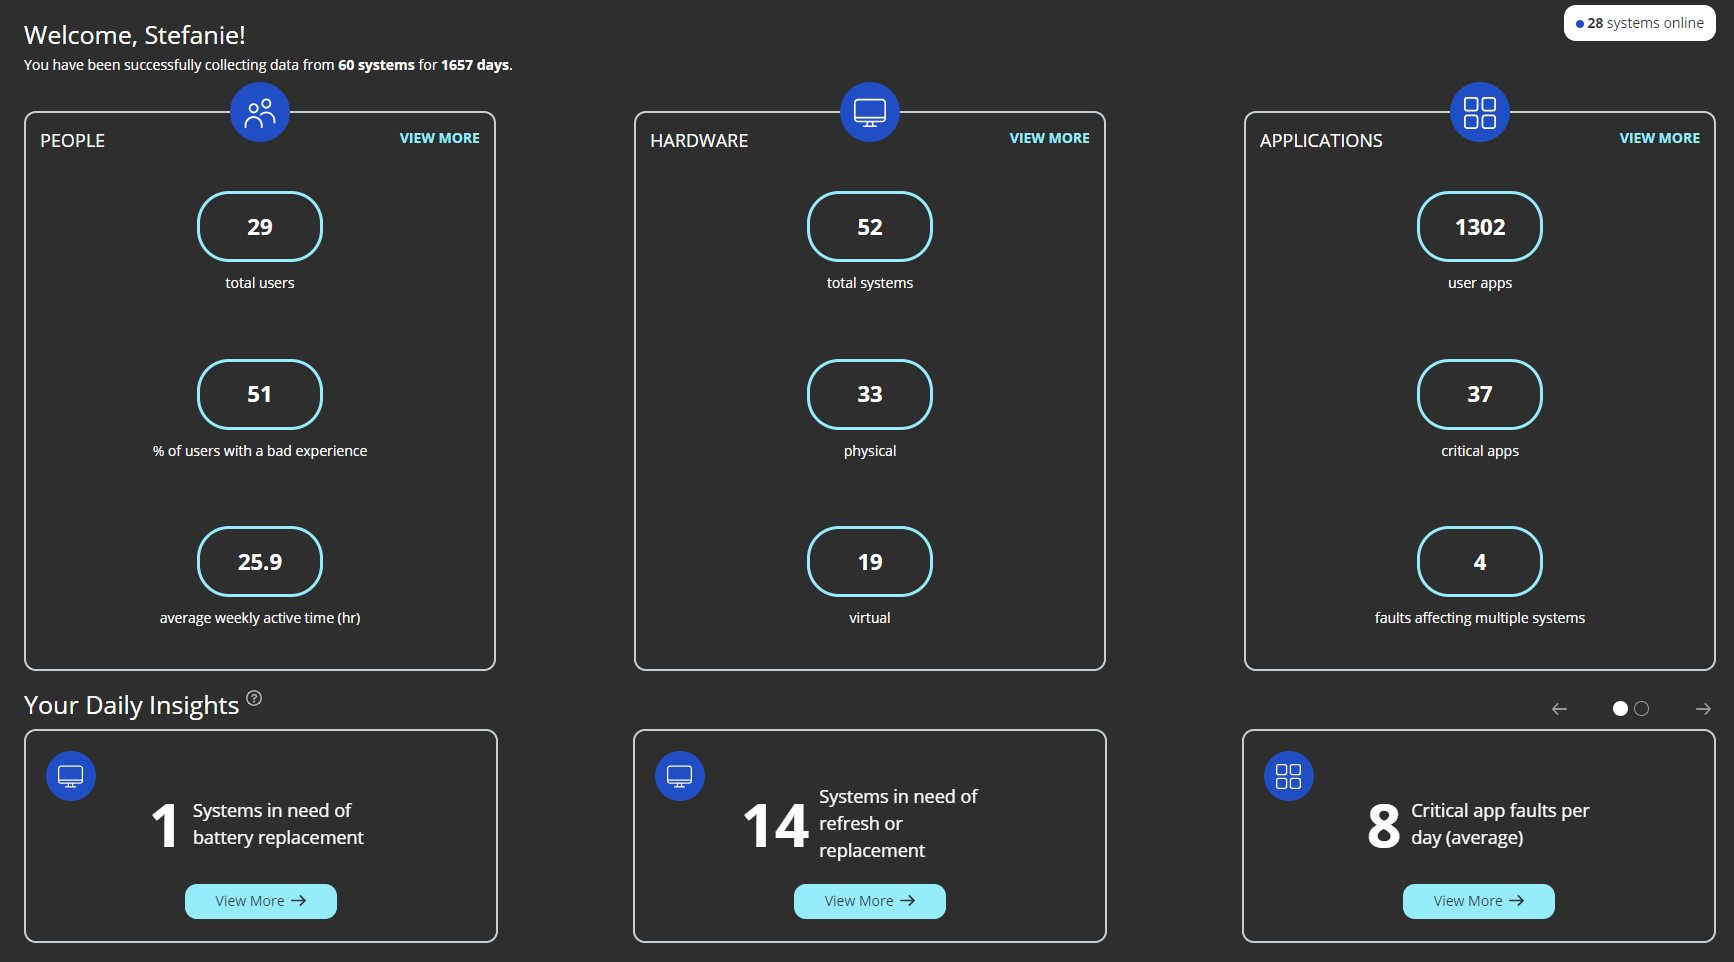
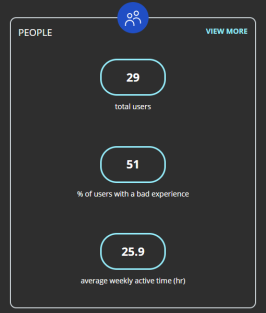
Total Users - The total number of users from the Enterprise Visualizer > People data set.
% of users with a bad experience - The percentage of users with fair and poor user experience. This value is a weighted average of users with fair and poor experience across both desktops and servers. It is a shortcut to Enterprise Visualizer > Health.
Weekly active time (hr) - The average time that users are logged in and active. It is a shortcut to Enterprise Visualizer > Health.
Combines the active minutes of all systems in Enterprise Visualizer to produce a weekly weighted average.
Hardware

This section shows the number of systems in the Enterprise Visualizer > Hardware data set, and their breakdown.
View More - Shortcut to Hardware in Enterprise Visualizer.
NOTE: This only shows if the user has access to Enterprise Visualizer > Hardware.
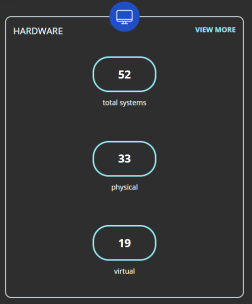
total systems - This is the number of systems which includes desktops, laptops, mobile devices, and servers (including virtual systems) in the Visualizer dataset.
Desktop - The number of desktops.
Laptop - The number of laptops.
If there are more than 10 virtual systems in your environment, the systems will be split between physical and virtual.
physical - The number of physical systems.
virtual - The number of virtual systems.
Each drill-down to Visualizer filters the system types to the relevant type.
TIP: To explore servers in your environment, go to the Server Visualizer.
NOTE: Only systems that have condensed data to the master are included in the Visualizer dataset.
Applications

View More - Shortcut to Applications in Enterprise Visualizer .
NOTE: This only shows if the user has access to Enterprise Visualizer > Applications.
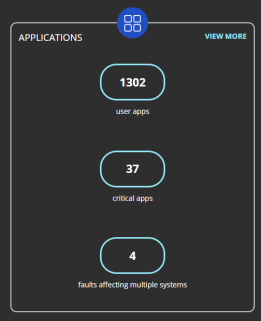
user apps - Total number of applications that have been run by user (not system) accounts in Enterprise Visualizer.
The drill-down to Visualizer filters to user apps.
critical apps - Total number of unique user critical applications as defined by Persona Visualizer.
Critical Apps are apps that have more than >5% of the users total focus time.
Shortcut to Persona Visualizer > User Critical Apps
faults affecting multiple systems - Total number of faults in Enterprise Visualizer where the affected systems are >10% of the total systems in Enterprise Visualizer data set.
Shortcut to Enterprise Visualizer > App Faults (filtered to faults affecting more than 10% systems).
Your Daily Insights

This is a carousel that you can click through which shows the number of the specific insight.
If you are an existing customer, the initial processing of data occurs in the first 24 hours. After which, Insights will be generated for you to browse.
If you are a new customer, tenants will take at least seven days to generate insights, after the first condense of data.
Insight are is then refreshed every 24 hours, overnight.
BSODs per system (average) - The average number of BSODs per system in the organization from the last 90 days.
Systems in need of refresh or replacement - The number of systems in the organization that are in need of a refresh or replacement. This could be a system with less than required resources (CPU/Memory) or a disk running low on capacity. See Hardware Refresh Factory User Guide for additional logic used.
Systems without BitLocker enabled - The number of Windows systems that do not have BitLocker enabled on one or more disks.
The query only targets the primary disk (C:).
Estate anomalies detected - This card only shows if you have the intelligence package. It will show the anomalies detected in the last 30 days.
Systems using unsecured Wi-Fi connections - The number of systems that have connected to un-secured Wi-Fi networks over the last 30 days. An unsecured Wi-Fi network is defined as one not using any type of password for access control.
Proactive automations (last week) - The total number of automations triggered across the organization from either Self-Help or an automated fix from a sensor trigger.
Average active sensors per system - The average active sensors per system in the previous 24hrs.
Systems in need of battery replacement - The number of systems with a battery health of less than the global value configured in Configure > Hardware Refresh. This is based on the design capacity of the battery, compared to its recent fully charged capacity. See Hardware Refresh
Critical app faults per day (average) - The average number of critical application faults (over the last 30 days) per system in the organization. A critical application is defined as an application in focus for more than 5% of the total application focus time. This is the top five critical apps per system.
On This Page